How to make graphs and other charts in org-mode? We’ll see some examples.
Graphviz
Using this (even in org-mode src blocks) requires graphqviz.
Elaborate example
// Cmd -layout : "neato", "fdp", "sfdp", "twopi", and "circo".
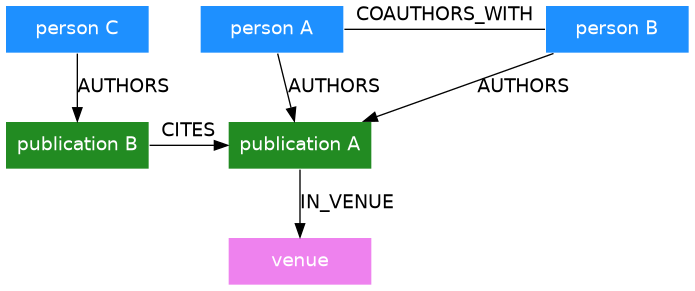
digraph {
edge [fontname="Bitstream Vera Sans"]
node [fontname="Bitstream Vera Sans"
shape="box" style="filled"
fillcolor="dodgerblue"
color="white" fontcolor="white"
width="1.5" fixedsize="false"]
person1 [label="person A"]
person2 [label="person B"]
person3 [label="person C"]
publication1 [label="publication A" fillcolor = "#228b22"]
publication2 [label="publication B" fillcolor = "#228b22"]
venue [label="venue" fillcolor="#Ee82ee"]
subgraph R1 {
edge [dir = none]
person1 -> person2 [label ="COAUTHORS_WITH"];
}
person1 -> publication1 [label ="AUTHORS"];
person2 -> publication1 [label ="AUTHORS"];
person3 -> publication2 [label ="AUTHORS"];
publication2 -> publication1 [label = "CITES"];
publication1 -> venue [label = "IN_VENUE"];
{ rank=same; person1 person2}
{ rank=same; publication1 publication2}
}
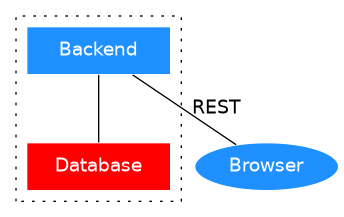
Dotted sub-graphs
digraph g {
   edge [fontname="Bitstream Vera Sans"]
   node [fontname="Bitstream Vera Sans"
        shape="box" style="filled" fillcolor="dodgerblue"
        color="white" fontcolor="white"
        width="1.5" fixedsize="false"]

   edge [dir = none]

   browser [label="Browser" shape = "oval"]


compound = true

# Has to start with `cluster_` to have dots
subgraph cluster_server {

    backend [label="Backend"]
    db [label="Database" shape = "box" fillcolor = "red"]
    backend -> db
    graph [style = dotted]
}

   backend -> browser [ label = "REST"]

# This one messes up dots
# {rank = same; backend browser}
}
Plantuml
Using plantuml with modernish stylesheets. Ofc requires plantuml.
Online preview
We can preview/generate diagrams online and preview stylesheets e.g. here.
C4-plantuml
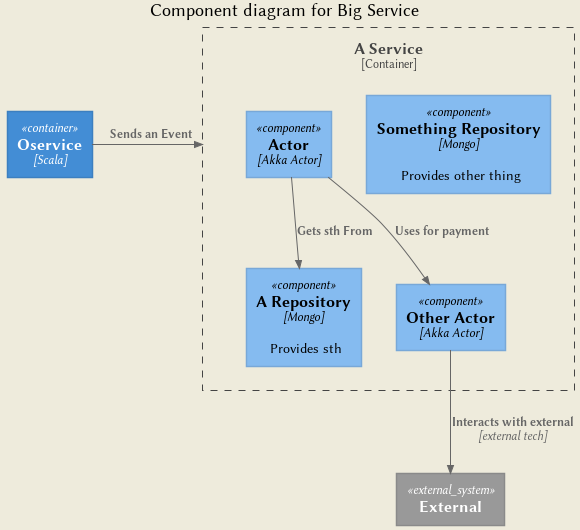
@startuml
 ' !includeurl https://raw.githubusercontent.com/RicardoNiepel/C4-PlantUML/master/C4_Component.puml
!include https://raw.githubusercontent.com/plantuml-stdlib/C4-PlantUML/master/C4_Component.puml
skinparam backgroundColor #EEEBDC

title Component diagram for Big Service

System_Ext(external, "External", "")
Container(oService, "Oservice", "Scala", "")

Container_Boundary(api, "A Service") {
    Component(aRepo, "A Repository", "Mongo", "Provides sth")
    Component(sthRepo, "Something Repository", "Mongo", "Provides other thing")
    Component(actor, "Actor", "Akka Actor", "")
    Component(otherActor, "Other Actor", "Akka Actor", "")

    Rel(actor, otherActor, "Uses for payment")
    Rel(otherActor,external, "Interacts with external", "external tech")
    Rel(actor, aRepo, "Gets sth From")
    Rel_R(oService,api,"Sends an Event")
}
@enduml
Class diagram
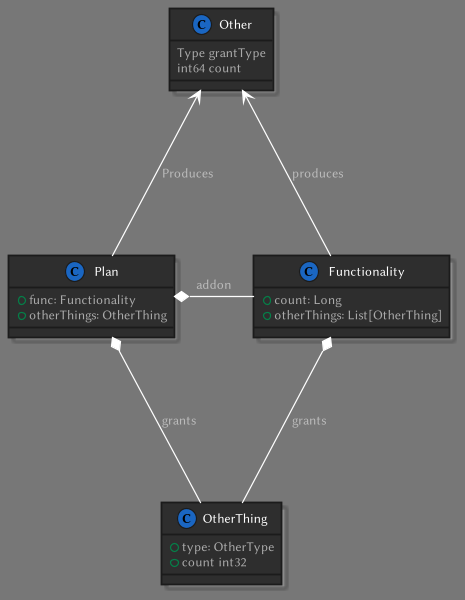
@startuml
!define DARKBLUE
!includeurl \
https://raw.githubusercontent.com/absltkaos/RedDress-PlantUML/update_preproc/style.puml
'https://github.com/Drakemor/RedDress-PlantUML/blob/master/style.puml
scale 600 height


class Plan {
    +func: Functionality
    +otherThings: OtherThing
}


class Functionality {
    +count: Long
    +otherThings: List[OtherThing]
}

class OtherThing {
    +type: OtherType
    +count int32
}


class Other {
    Type grantType
    int64 count
}


Plan *--- Functionality : addon
Functionality *--- OtherThing : grants
Plan *--- OtherThing : grants

Other <--- Plan: Produces
Other <--- Functionality: produces


Plan -[hidden] Functionality


@enduml
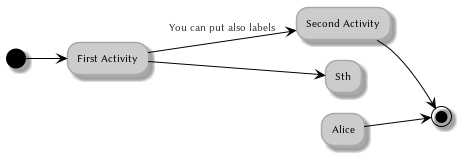
Flow diagram
@startuml
!define LIGHTBLUE
!includeurl \
https://raw.githubusercontent.com/absltkaos/RedDress-PlantUML/update_preproc/style.puml
left to right direction
(*) --> "First Activity"
-->[You can put also labels] "Second Activity"
--> (*)
"First Activity" --> "Sth"
"Alice" --> (*)
@enduml
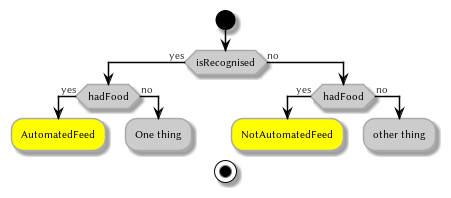
Activity Diagram
@startuml
!define LIGHTBLUE
!includeurl \
https://raw.githubusercontent.com/absltkaos/RedDress-PlantUML/update_preproc/style.puml

start
if (isRecognised) then (yes)
  if (hadFood) then (yes)
                #yellow:AutomatedFeed;
                detach
   else (no)
                :One thing;
                detach
   endif
else (no)
   if(hadFood) then (yes)
        #yellow:NotAutomatedFeed;
        detach
    else (no)
        :other thing;
        detach
    endif
endif
stop
@enduml
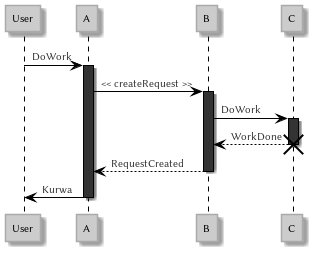
Sequence diagram
https://plantuml.com/sequence-diagram
@startuml
!define LIGHTBLUE
!includeurl \
https://raw.githubusercontent.com/absltkaos/RedDress-PlantUML/update_preproc/style.puml
participant User

User -> A: DoWork
activate A

A -> B: << createRequest >>
activate B

B -> C: DoWork
activate C
C --> B: WorkDone
destroy C

B --> A: RequestCreated
deactivate B

A -> User: Done
deactivate A
@enduml
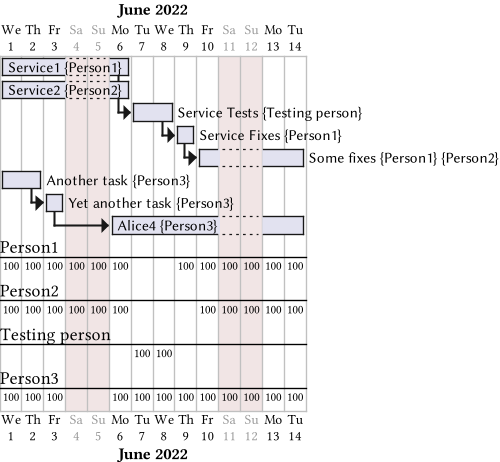
Gantt Chart
@startgantt
'https://plantuml.com/gantt-diagram#aa3233ceafb875a4
Project starts the 2022/06/01
saturday are closed
sunday are closed

scale 500 width

[Service1] on {Person1} lasts 4 days
[Service2] on {Person2} lasts 4 days

[Service Tests] on {Testing person} starts at  [Service1]'s end and lasts 2 days
then [Service Fixes] on {Person1} lasts 1 days

[Some fixes] on {Person1} {Person2} starts at [Service Fixes]'s end and lasts 6 days

[Another task] on {Person3} lasts 2 days
then [Yet another task] on {Person3} lasts 1 days
then [Alice4] on {Person3} lasts 7 days
@endgantt
Comments